Monitor Global Supply Chains and Commodity Disruptions in Real Time
In March 2021, the Ever Given blocked the Suez Canal for six days and held up an estimated $9.6 billion of trade per day. Most people learned about it from social media. Traders who already watched ship positions, chokepoint traffic and freight rates saw the impact before it reached the headlines.
The Planet gives commodity traders that kind of multi-source view: prices, physical infrastructure and the geopolitical events that disrupt them, in one app.
Why Commodity Traders Need More Than Price
Commodity prices react to physical events: a strike on a refinery, a pipeline outage, a port closure, a drought in a growing region, an export ban. These events start far from the price screen:
- Houthi attacks in the Red Sea force rerouting around the Cape of Good Hope
- A coup in a mining country puts critical mineral supply at risk
- GPS jamming in a busy sea lane disrupts navigation
- A heatwave or drought cuts crop yields and river shipping capacity
- An export control on a single mineral reprices a whole supply chain
A price chart shows the reaction. The Planet shows the cause and where it is likely to spread.
The Energy Tab
The Energy tab at theplanet.today/app/energy is built for oil, gas and refined products:
- Energy Complex: crude, products and natural gas prices
- Oil Inventories: US crude and SPR stocks, natural gas storage, EU gas storage fill and OECD days of cover
- Fuel Prices: retail gasoline and diesel prices across 30+ countries, in USD per liter
- Hormuz Trade Tracker and Chokepoint Status: traffic through the corridors that matter most for energy
- Oil and Gas Pipeline Status: which pipelines are operating, reduced or offline
- Strategic Storage Atlas: where strategic reserves and storage capacity sit
- Global Fuel Shortage Registry: reported fuel shortages by country
- Energy Disruptions Log: a running log of outages, attacks and supply interruptions
- Energy Crisis Tracker and Global Energy Risk Overview: the overall risk picture
- Energy and Resources news
Metals and Materials
In the Markets tab, Metals and Materials and Gold Intelligence cover precious and industrial metals. The Supply Chain panel’s Critical Minerals view scores how concentrated production is for gallium, germanium, rare earths, cobalt and lithium, which tells you how exposed a market is to a single country’s export policy. COT Positioning adds CFTC futures positioning, so you can see whether speculators are already crowded on one side.
Physical Infrastructure on the Map
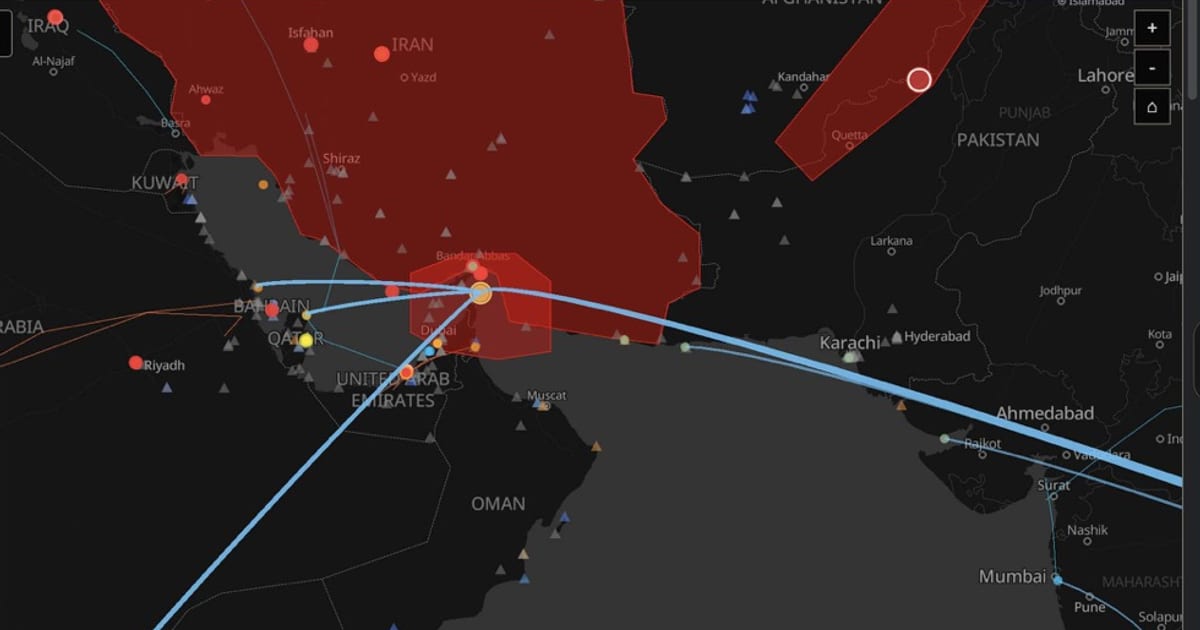
The Live Map shows the infrastructure that commodity flows depend on. Toggle these layers on theplanet.today/app/live-map:
- Pipelines and storage facilities
- Fuel shortages by location
- Undersea cables
- Chokepoints, trade routes and ship traffic
- Critical minerals production areas
- Sanctions, conflict zones and intel hotspots
- Fires, natural events and weather alerts
Overlaying conflict on infrastructure is the core move. When a conflict layer lights up near a pipeline route or a chokepoint, you can see the exposure immediately instead of piecing it together from separate reports.
Ships and Chokepoints
The Supply Chain panel’s Chokepoints view scores major corridors (Hormuz, Bab el-Mandeb, Suez, Malacca, Panama, the Taiwan Strait, the Bosporus and more) on traffic and disruption, and its Shipping Rates view tracks container and dry bulk freight indices. For a full walkthrough, see tracking global trade routes, chokepoints and freight costs.
Infrastructure Cascade
The Infrastructure Cascade panel in the Conflicts tab shows the second-order picture: which cables, pipelines, ports and chokepoints are exposed when a situation escalates. That is what turns a local incident into a market event, and it is the part most price-only tools miss.
Natural Hazards and Weather
Supply is also exposed to nature. The Climate tab and the map cover:
- Earthquakes from USGS (magnitude 4.5 and above)
- Satellite-detected fires from NASA FIRMS
- Natural events such as storms, floods and volcanic activity
- Climate anomalies such as heat and drought stress
- Weather alerts
See natural disaster monitoring for traders for how these feed into agriculture, energy and insurance trades.
Workflows for Commodity Traders
Morning check
- Scan the Energy Disruptions Log and Pipeline Status for anything new overnight.
- Check Chokepoint Status and the Hormuz Trade Tracker.
- Review the Country Instability Index for rising scores in producer countries.
- Check freight indices in the Supply Chain panel.
- Look at COT Positioning and the Economic Calendar for scheduled risk.
When something breaks
- Find the event on the Live Map and toggle pipelines, chokepoints and ship traffic.
- Check Infrastructure Cascade for what is exposed nearby.
- Watch the Energy Complex, Metals and Materials and freight indices for the reaction.
- Check prediction markets for how the crowd prices escalation or resolution.
- Share the exact map view with a link; the map state is saved in the URL.
Ongoing
- Signed-in users can set up My Monitors on their dashboard to highlight headlines that match keywords such as “pipeline”, “export ban” or a specific commodity.
What Pro Adds
The app is free. Pro ($39.99 per month or $399.99 per year) adds Trade Policy (tariffs, barriers and customs data by country), Global Procurement (open government tenders worldwide), the Daily Market Brief, AI Market Implications, AI Forecasts and the AI Analyst. See the Pro page.
Frequently Asked Questions
Is the Energy tab free? Yes. The Energy tab, the Supply Chain panel and the infrastructure map layers are free to use. Pro adds AI and research panels such as Trade Policy and the Daily Market Brief.
Can I get alerts for specific disruptions? Signed-in users can add keyword monitors in My Monitors on their dashboard, so matching headlines for terms like “port closure” or “pipeline” stand out.
Does The Planet include geopolitical risk next to commodity data? Yes. Conflict layers, the Country Instability Index and Infrastructure Cascade sit next to energy, metals and freight data, so you see disruption risk alongside price.
Start monitoring at theplanet.today/app/energy.