Tracking Global Trade Routes, Chokepoints, and Freight Costs in Real Time
Key takeaways: A handful of maritime chokepoints carry a large share of the world’s oil, LNG and container trade. When one is disrupted, the effect shows up in vessel counts first, then freight indices, then commodity prices. The Planet tracks all three in one place, alongside trade policy and critical mineral concentration.
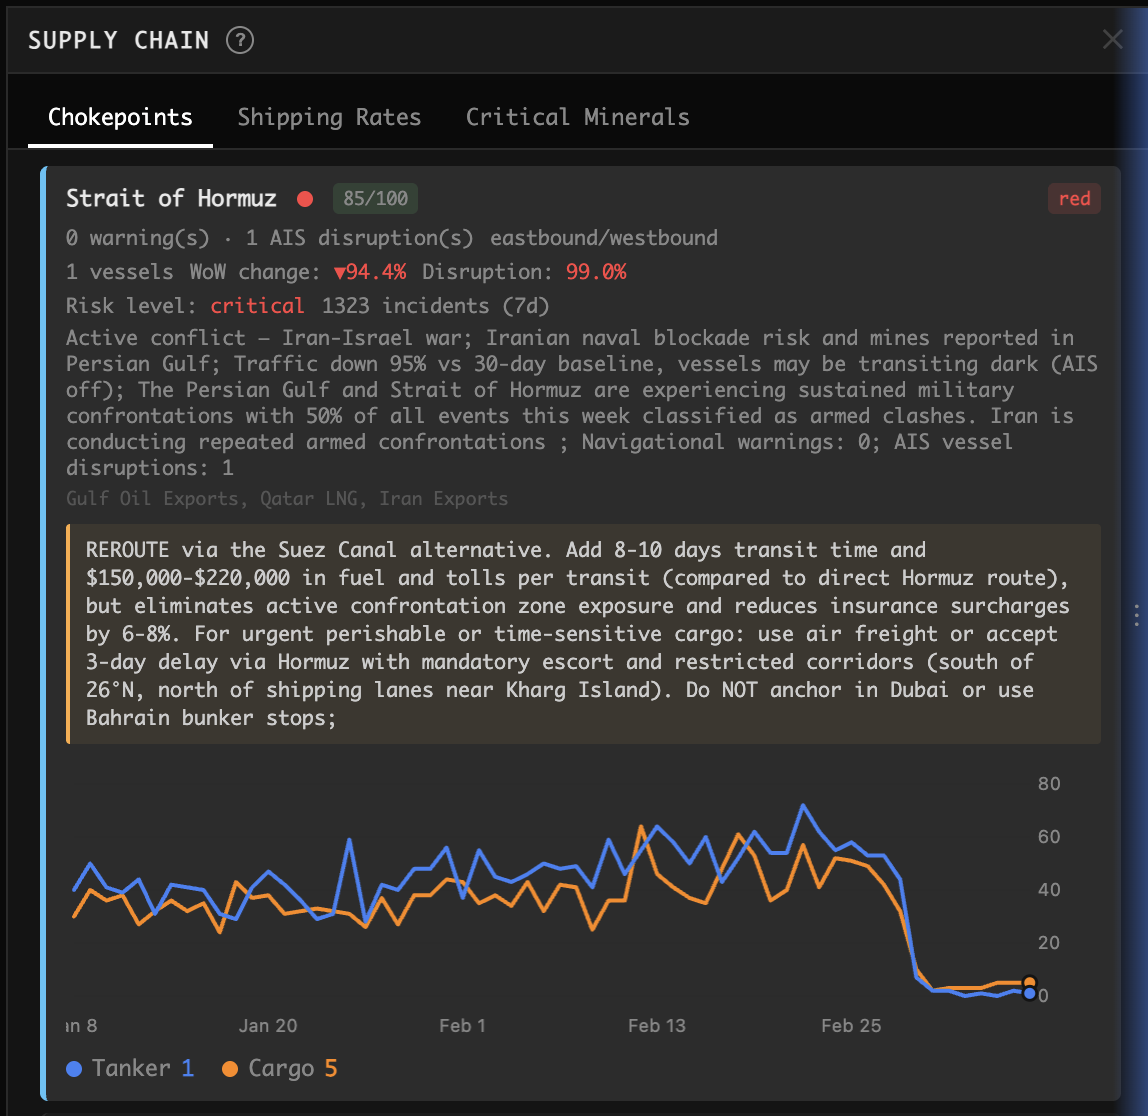
The Strait of Hormuz carries roughly a fifth of the world’s oil. In early March 2026, the chokepoint card for Hormuz in The Planet’s Supply Chain panel (pictured above) showed tanker and cargo transits collapsing to near zero after late February, alongside a critical risk rating and a shipping advisory recommending rerouting.
That is the kind of move that reprices crude, LNG, tanker rates and every business that depends on Gulf trade. This guide explains how to follow it as it happens.
Chokepoints: Where Trade Can Be Cut
The Chokepoints tab of the Supply Chain panel scores major maritime corridors on disruption level, vessel traffic and nearby conflict activity. The corridors tracked include:
- Strait of Hormuz: Gulf crude, products and Qatari LNG
- Bab el-Mandeb and the Suez Canal: the Red Sea route between Asia and Europe
- Strait of Malacca: the main Asia to Middle East and Europe lane
- Panama Canal: Atlantic to Pacific trade
- Taiwan Strait and Korea Strait: East Asian shipping and semiconductor supply
- Bosporus and Kerch Strait: Black Sea grain, oil and fertilizer
- Cape of Good Hope: the main diversion route when Suez or Bab el-Mandeb is disrupted
- Strait of Gibraltar, Dover Strait and Lombok Strait
Each corridor card shows vessel counts, week-over-week change, a disruption score, a risk level, the related conflict context and, where relevant, an advisory on rerouting.
What makes this different from a ship tracker
A ship tracker shows where vessels are. The Chokepoints view shows why traffic has changed: it cross-references vessel transits with conflict events, navigational warnings and military activity, so a falling vessel count comes with the reason it is falling.
The Energy tab adds a dedicated Hormuz Trade Tracker and a Chokepoint Status strip, so energy traders can keep the most important corridors in view without opening the full panel.
Freight Costs: The Price of a Detour
When a chokepoint closes, ships take longer routes and freight costs rise. The Shipping Rates tab tracks the indices that quantify that:
Container rates
- SCFI (Shanghai Containerized Freight Index): spot container rates out of Shanghai
- CCFI (China Containerized Freight Index): broader Chinese export container costs
Dry bulk
- BDI (Baltic Dry Index): the benchmark for iron ore, coal and grain shipping
- BCI (Baltic Capesize Index): the largest bulk carriers on long-haul routes
- BPI (Baltic Panamax Index): mid-size vessels, often grain and coal
- BSI (Baltic Supramax Index) and BHSI (Baltic Handysize Index): smaller vessels and regional trade
Reading chokepoint data and freight data together is the point. When ships divert around the Cape of Good Hope, voyages get longer and demand for larger vessels rises, which tends to show up in Capesize and container rates. Seeing both in the same panel makes the link obvious. For how these costs ripple into commodity prices, see monitoring supply chains and commodity disruptions.
Critical Minerals: Concentration Risk
Some supply chains cannot be rerouted because the supply itself sits in one or two countries. The Critical Minerals tab measures that with the Herfindahl-Hirschman Index (HHI), where a higher score means production is more concentrated. It covers:
- Gallium and Germanium, dominated by China and essential for semiconductors
- Rare Earths, critical for magnets in EVs, wind turbines and defense systems
- Cobalt, concentrated in the Democratic Republic of Congo
- Lithium, led by Australia with significant output elsewhere
High concentration means a single export control decision can move prices sharply, as gallium and germanium did when China restricted exports in 2023. The HHI view makes that exposure visible before the next restriction is announced.
Trade Policy (Pro)
Disruptions intersect with policy: tariffs, restrictions and non-tariff barriers decide where goods can flow even when sea lanes are open. The Trade Policy panel, part of Pro, tracks tariffs, trade barriers and customs data by country, with trends and restrictions, drawing on WTO data.
How It Connects
Take a chokepoint disruption through each layer:
- Chokepoints: vessel counts fall and the disruption score climbs; ships divert to longer routes.
- Freight: longer voyages lift bulk and container rates.
- Energy: the Energy tab shows crude, product and gas prices, inventories and disruptions reacting.
- Trade policy and minerals: importers’ alternatives and concentration risk decide how fast supply can adjust.
- Markets: prediction markets and AI forecasting show how the crowd and the models see the next step.
No single source shows this full picture. The Planet puts it in one app.
Data Sources
- Vessel transits: AIS-based transit data, compared with historical baselines
- Conflict events: conflict event datasets such as ACLED
- Container indices: Shanghai Shipping Exchange
- Bulk indices: Baltic Exchange indices
- Trade policy: WTO data
- Critical minerals: 2024 production by country, with HHI calculated by The Planet
Frequently Asked Questions
What is the Baltic Dry Index (BDI)? The BDI measures the cost of shipping dry bulk commodities such as iron ore, coal and grain on major ocean routes. It is widely watched as a read on real demand for shipping capacity and, by extension, global trade activity.
How does the Strait of Hormuz affect oil prices? Roughly 20% of the world’s oil and a large share of global LNG pass through Hormuz. When traffic falls or the strait is threatened, energy markets price in supply risk, and tanker and insurance costs typically rise as well.
Is the Supply Chain panel free? Yes. Chokepoints, Shipping Rates and Critical Minerals are free in the app. The Trade Policy panel is part of Pro ($39.99 per month or $399.99 per year).
Open the Supply Chain panel in the Markets tab and the Hormuz Trade Tracker in the Energy tab.