Track Global Conflicts in Real Time: Geopolitical Risk for Traders
When a military escalation begins, the first hours decide how markets price it. Traders who see the early signals (unusual military activity, a spike in reporting from one region, a new hotspot near a shipping lane) have time to assess exposure before the move is obvious on a chart.
The Planet is built to surface those signals and connect them to the assets they affect. This guide covers how conflict tracking works in the app.
Conflict Data on a Live Map
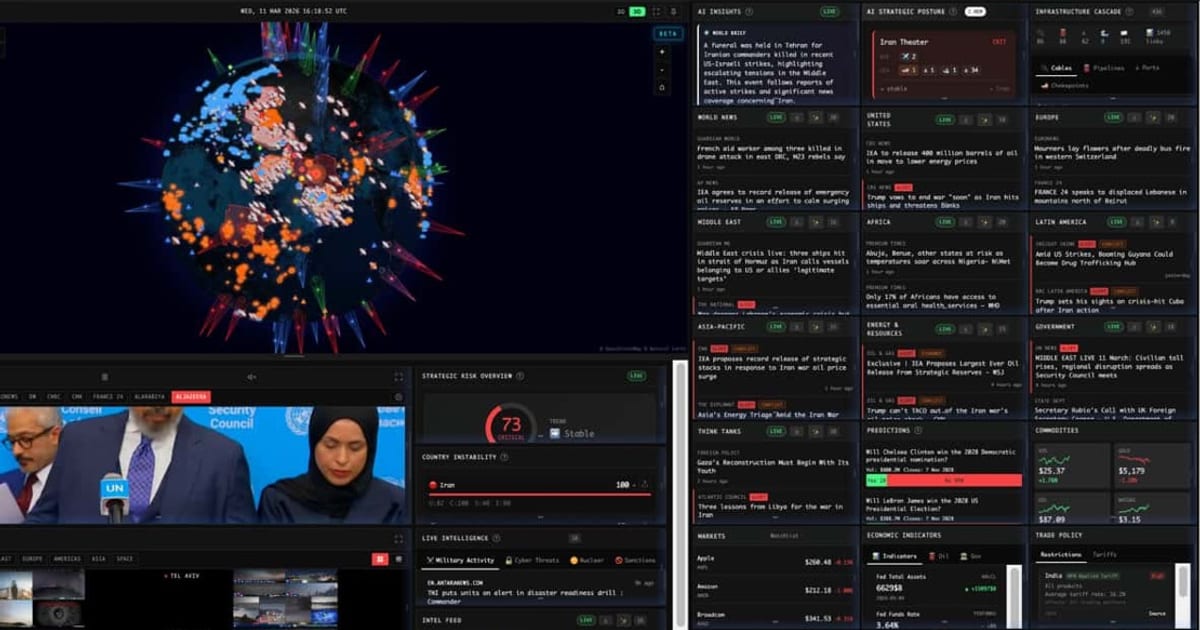
The Live Map at theplanet.today/app/live-map layers several conflict-related sources on one 2D map or 3D globe:
- Conflict zones and intel hotspots: areas with active fighting or elevated activity
- Armed conflict events from datasets such as ACLED and UCDP
- Military bases and military activity, including tracked military aircraft
- Ship traffic and trade routes, to see naval and commercial movements around flashpoints
- GPS jamming zones inferred from aircraft transponder anomalies
- Protests, sanctions, nuclear sites and radiation watch
- Country Instability, a choropleth that turns the map into a risk heatmap
Each layer can be toggled on its own. Combining them is where the value is: a flare-up next to a pipeline, a chokepoint or a major port is a different trade from one in a landlocked region.
The Conflicts Tab
The Conflicts tab at theplanet.today/app/conflicts groups the panels that matter when a situation is developing:
- Intel Feed: a running feed of conflict and security headlines
- Force Posture and Escalation Monitor: where military activity and escalation indicators are building
- Strategic Risk Overview: a single read on global strategic risk and its trend
- Government and Think Tanks: official statements and expert analysis
- Country Instability: live instability scores by country
- Infrastructure Cascade: cables, pipelines, ports and chokepoints exposed to an event
- Airline Intelligence: airspace and airline disruption
- UCDP Conflict Events, Security Advisories, Radiation Watch, Israel Sirens and a World Clock
Pro adds the Daily Brief, Deduct Situation (describe a situation and get likely next moves, risks and market impact) and Regional Intelligence (briefs and risk snapshots for each region).
The Country Instability Index
Every tracked country gets a live instability score from 0 to 100. The score blends two parts:
- Baseline risk (40%): a structural starting point for each country
- Live events (60%): a weighted mix of unrest, armed conflict, security events and information flow (how much the country is in the news and how fast that is changing)
On top of that, boosts are applied for signals such as proximity to active hotspots, government travel advisories, large displacement outflows, climate stress, earthquakes and sanctions.
For a trader, the useful part is the direction. A score that has been rising for a week in a country that matters for oil, metals, grain or a currency you hold deserves a closer look, often before the story leads international news.
Nine Theaters Under Watch
The AI Strategic Posture panel in the Intelligence tab assesses military posture across nine theaters:
- Iran
- Taiwan Strait
- Baltic
- Black Sea
- Korean Peninsula
- South China Sea
- Eastern Mediterranean
- Israel and Gaza
- Yemen and the Red Sea
Each one maps to obvious market exposures: Iran and the Red Sea to crude, LNG and freight; the Taiwan Strait and South China Sea to semiconductors and Asian shipping; the Black Sea to grain and fertilizer; the Baltic to European energy and defense names.
The Intelligence Tab: Weak Signals, Lined Up
The Intelligence tab at theplanet.today/app/intel is where signals from different sources are put side by side:
- Cross-Source Signals: when separate sources start pointing at the same event
- AI Insights: a running synthesis of the most important developments
- Live Intelligence: GDELT-based monitoring of military activity, cyber threats, nuclear and sanctions news
- Telegram Intel and Social Velocity: fast, unfiltered reporting and how quickly a topic is spreading
- Thermal Escalation: satellite-detected heat signatures that can indicate strikes or fires in conflict areas
- Economic Warfare, Disaster Cascade and the Threat Timeline
Raw channels such as Telegram are often faster than mainstream media but also noisier. The value comes from checking them against the map and the structured panels before acting.
From Conflict to Market Impact
Here is how a developing situation typically flows through the app:
- A new hotspot appears on the map and the Intel Feed picks up the first reports.
- The Escalation Monitor and Force Posture show whether military indicators are building.
- Infrastructure Cascade and the map show which chokepoints, pipelines or ports are nearby.
- The Energy tab and the Supply Chain panel show whether flows, prices and freight are reacting (see monitoring supply chains and commodity disruptions).
- Prediction markets show how the crowd prices the next step (see prediction markets and AI forecasting).
That chain, from event to exposure to price, is what The Planet is built for. For an overview of every tab, see What Is The Planet?.
Sharing a View
The map state (position, zoom and active layers) is encoded in the URL, so you can send a colleague a link that opens on exactly what you are looking at.
Frequently Asked Questions
What data does The Planet use for conflict tracking? The Planet combines conflict event datasets such as ACLED and UCDP, military and ship tracking, GPS jamming detection, satellite fire detection, government advisories, news and GDELT monitoring, and Telegram channels.
Is conflict tracking free? Yes. The Live Map, the Conflicts tab and the Intelligence tab are free to use. Pro ($39.99 per month or $399.99 per year) adds AI panels such as Deduct Situation, Regional Intelligence, AI Forecasts and the AI Analyst.
How does the Country Instability Index work? Each country’s score blends a baseline risk (40%) with live events (60%): unrest, armed conflict, security events and information flow. Boosts are added for signals such as nearby hotspots, travel advisories, displacement, earthquakes and sanctions.
Follow developing situations at theplanet.today/app/conflicts.