What Is The Planet? Live Geopolitical and Macro Intelligence for Traders
A tanker is struck near the Strait of Hormuz. A central bank surprises the market. A new sanctions package lands on a Friday evening. Each of these moves prices, and each one usually reaches a trader as a scattered set of headlines across a dozen tabs.
The Planet puts those signals in one place. It is live geopolitical and macro intelligence for traders: conflicts, sanctions, central banks, energy and shipping, tracked from 30+ data sources and translated into likely market impact.
Why Traders Need Geopolitical Context
Price charts tell you that something moved. They rarely tell you why, or whether the move has further to run. Geopolitical events are a large share of the “why” behind sudden repricing in oil, gold, currencies, freight and defense names, and the edge comes from seeing the event, its location and its likely second-order effects before the move is fully priced.
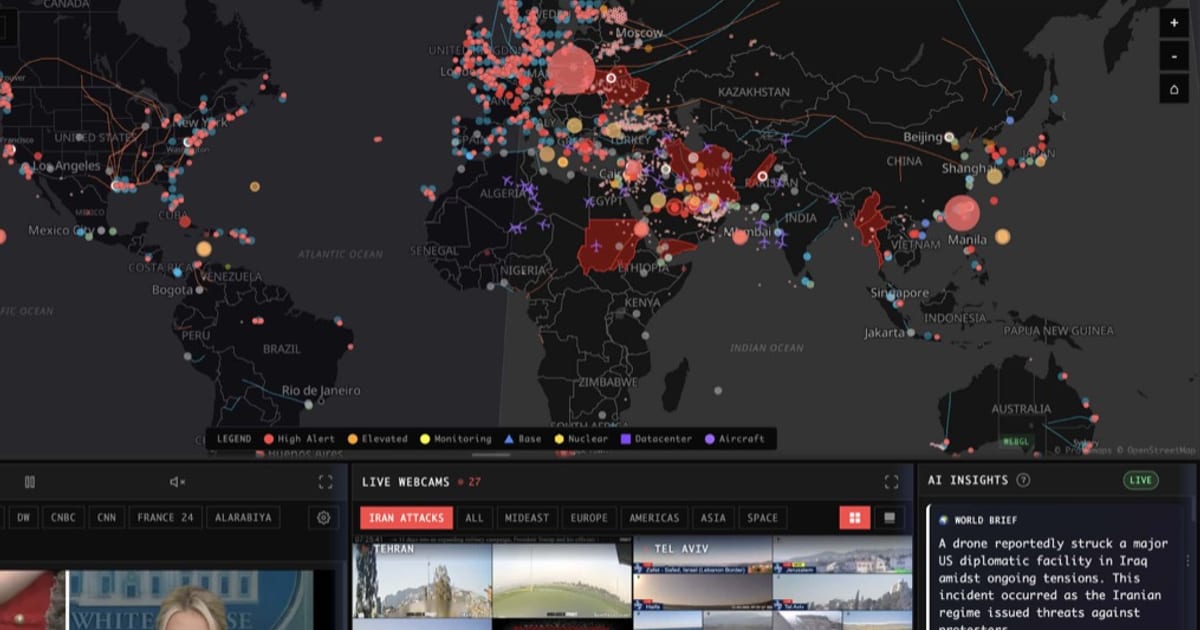
The Planet is built around that workflow. Instead of reading the news and then switching to a chart, you see the event on a live map, the panels that quantify its impact, and the markets most exposed to it, side by side.
What Is Inside the App
The app lives at theplanet.today/app and is organized into tabs, each focused on one part of the picture.
Live Map
The default view is an interactive map (2D or 3D globe) with toggleable layers: conflict zones and intel hotspots, armed conflict events, military bases and military activity, ship traffic and trade routes, chokepoints, pipelines, undersea cables, sanctions, critical minerals, natural events, fires, weather alerts, internet disruptions, GPS jamming and a Country Instability choropleth. Layers can be combined, so you can see, for example, whether a flare-up sits on top of a pipeline route or a shipping lane.
News
Live headlines grouped by source type (wire services, intelligence and defense outlets, market news, government sources and more), plus regional geopolitics news. The goal is to see a story break and see where it sits on the map in the same session.
Conflicts
The Conflicts tab brings together the Intel Feed, Force Posture, the Escalation Monitor, the Strategic Risk Overview, the Country Instability Index, Infrastructure Cascade, UCDP conflict events, government security advisories and Airline Intelligence. It answers two questions: where is the situation getting worse, and what infrastructure is exposed to it. More detail is in tracking global conflicts in real time.
Energy
Energy Complex prices, oil inventories, fuel prices, the Hormuz Trade Tracker, Chokepoint Status, Oil and Gas Pipeline Status, the Strategic Storage Atlas, the Global Fuel Shortage Registry, the Energy Disruptions Log and a Global Energy Risk Overview. For energy traders, this is where a geopolitical headline becomes a supply number.
Intelligence
Cross-source signals, AI Strategic Posture across nine military theaters, AI Insights, Live Intelligence (GDELT), Telegram Intel, Social Velocity, Thermal Escalation, Economic Warfare and the Threat Timeline. This tab is where weak signals from different sources are lined up so you can see when they start pointing the same way.
Markets
Equity indices, Macro Stress, Market Radar, Fear and Greed, AAII Sentiment, Market Breadth, Financial Stress, the Yield Curve, Economic and Earnings Calendars, COT Positioning, Gold Intelligence, Metals and Materials, Sanctions Pressure, Supply Chain (chokepoints, shipping rates and critical minerals) and prediction markets from Polymarket and Kalshi. See real-time market intelligence for traders for how these fit into a trading day.
Tech, Crypto and Climate
The Tech tab covers AI, semiconductors, cloud, internet disruptions and service status. The Crypto tab covers crypto prices and heatmaps, BTC ETF flows, stablecoins and the crypto Fear and Greed Index. The Climate tab tracks climate anomalies, satellite-detected fires, population exposure, disease outbreaks and displacement, which matter for agriculture, insurance and commodity supply (see natural disaster monitoring for traders).
From Event to Likely Market Impact
The point of putting all of this in one app is to shorten the path from “something happened” to “here is what it probably means for the assets I trade”. A typical chain looks like this:
- Event: An escalation shows up in the Intel Feed and as a new hotspot on the map.
- Exposure: The map shows that the area overlaps a chokepoint, a pipeline or a major producer; Infrastructure Cascade lists what is nearby.
- Quantification: Energy and Supply Chain panels show whether flows, prices or freight rates are already reacting.
- Market read: Markets panels show how oil, gold, rates and risk sentiment are moving, and prediction markets show how the crowd is pricing the next step.
The free app covers this whole chain with live data. Pro adds AI analysis on top of it.
Free App and Pro
The Planet app is free to use. Pro ($39.99 per month or $399.99 per year) unlocks the AI and research panels, including:
- AI Forecasts: probability forecasts for geopolitical and market events, updated as new signals arrive
- AI Analyst: ask about any country, conflict or market and get an answer grounded in live data
- Deduct Situation: describe a situation and get a deduction of likely next moves, risks and market impact
- Daily Brief and Daily Market Brief: AI-written briefs linking overnight world events to the assets you trade
- AI Market Implications: cards mapping today’s events to tickers, with direction, timeframe and the risk caveat
- Stock Analysis and Backtesting, Trade Policy, Regional Intelligence, SEC Material Events and Global Procurement
The full list is on the Pro page. A separate API plan ($99.99 per month) is available for teams that want the data programmatically.
Who It Is For
The Planet is built for people who trade or allocate around macro and geopolitical risk: discretionary macro and commodity traders, equity traders who need to know why a sector is moving, crypto traders watching risk sentiment and liquidity, and analysts who brief a desk every morning.
It does not give investment advice, and no single panel should drive a trade on its own. It gives you context faster, so your own process starts from a better picture.
Frequently Asked Questions
Is The Planet free? Yes. The app is free to use. Pro ($39.99 per month or $399.99 per year) unlocks the AI and research panels such as AI Forecasts, the AI Analyst and the Daily Market Brief.
What data does The Planet use? The Planet aggregates 30+ data sources, including conflict event datasets such as ACLED and UCDP, ship and aircraft tracking, NASA fire detection, USGS earthquakes, central bank and economic data, energy data, freight indices and prediction markets.
Does The Planet tell me what to trade? No. The Planet shows events, exposure and likely market impact so you can make faster, better-informed decisions. It does not provide investment advice.
Open the live app at theplanet.today/app and follow @theplanet_today on X for updates.