Earthquake, Fire, Flood: Real-Time Natural Disaster Monitoring for Traders
Natural disasters are market events. A large earthquake near a chip fab or a port, a wildfire season across a growing region, a hurricane in the Gulf of Mexico, a drought that lowers a river used for barge traffic: each one can move commodity prices, insurance stocks, shipping rates and local currencies, often within hours.
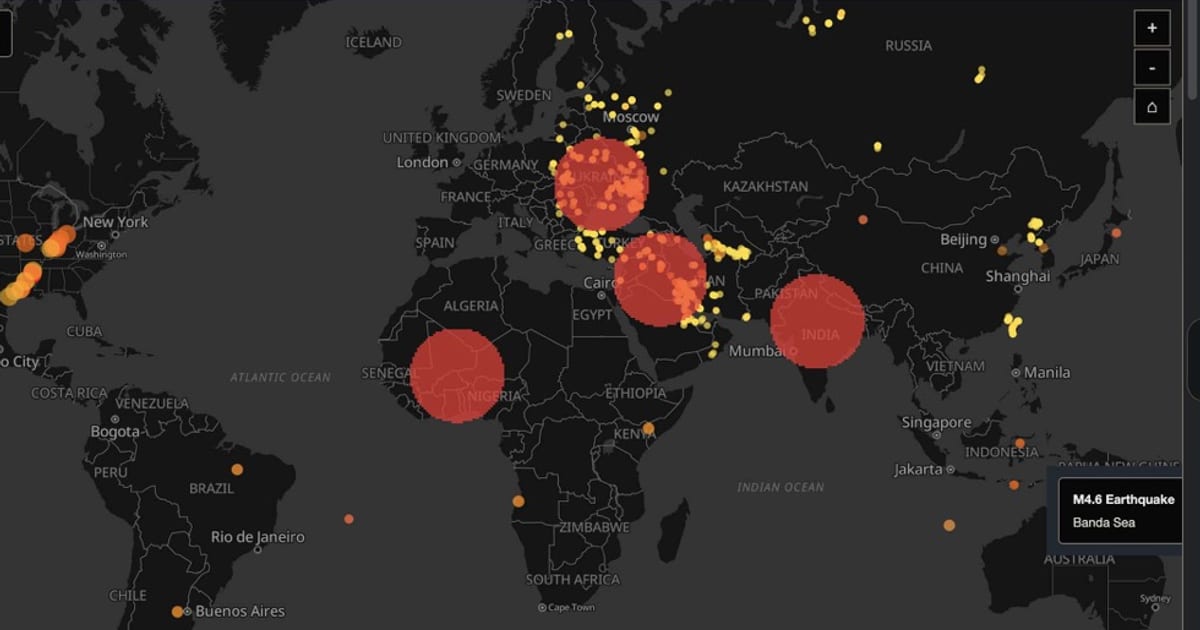
The Planet tracks these hazards on the same map as conflict, infrastructure and markets, so you can see not only where something happened but what it is likely to affect.
The Hazard Data Streams
Earthquakes
The Planet ingests the USGS feed of earthquakes of magnitude 4.5 and above worldwide. Each event appears on the map with its magnitude and location, and large quakes are usually followed quickly by wire headlines in the News tab, so you get the seismic data and the reporting side by side.
Why it matters for markets: earthquakes can damage fabs, refineries, ports and undersea cables. A strong quake near semiconductor production, a major port or a cable landing station has consequences far beyond the region. Because the earthquake layer shares the map with infrastructure layers and the Country Instability Index, those connections are visible at a glance. Earthquakes also feed into instability scores.
Satellite-Detected Fires
The Fires panel and map layer use NASA FIRMS (VIIRS) satellite detections of thermal anomalies. They reveal:
- Wildfires across forests and farmland
- Agricultural burning, which matters for crops such as palm oil and sugarcane
- Industrial fires at refineries, plants or storage sites
- Conflict-related fires from strikes, which the Thermal Escalation panel in the Intelligence tab tracks against baselines
When a fire cluster appears near a refinery, a pipeline or a conflict zone, you may be looking at a supply event before it is reported.
Storms, Floods and Volcanoes
The Natural Events layer uses NASA EONET for severe storms and tropical cyclones, floods, volcanic eruptions and other large events. Volcanic ash can close airspace for days, and storms in key producing or shipping regions affect energy, agriculture and freight. The Weather Alerts layer adds active weather warnings.
Climate Anomalies
The Climate Anomalies panel and layer track temperature and precipitation anomalies. These are slow-moving but powerful signals:
- Drought that threatens crop yields and water-intensive industry
- Excess rainfall that raises flood risk and delays harvests
- Heat that drives power demand and stresses grids
For agricultural and energy traders, anomalies are often the earliest sign of a supply story that will matter months later.
The Climate Tab
The Climate tab at theplanet.today/app/climate brings these together with the human side of disasters:
- Climate Anomalies and Fires
- Population Exposure: estimated population inside an event’s impact radius, based on WorldPop density data
- Disease Outbreaks: active outbreak alerts from WHO, ProMED and health ministries
- UNHCR Displacement: displacement flows by country
- Climate News and Global Giving
Displacement and outbreaks matter to markets too. Large displacement outflows raise a country’s instability score, and outbreaks can disrupt labor, travel and trade.
Disaster Cascade: What Breaks Next
The Disaster Cascade panel in the Intelligence tab correlates earthquakes, wildfires, floods and weather extremes, tracks their likely effects on infrastructure and supply chains, and highlights regions where risks are compounding. Click a card to zoom to the affected region.
Combine it with the map layers for pipelines, undersea cables, chokepoints and storage facilities, and the Infrastructure Cascade panel in the Conflicts tab, to see which assets are exposed. For more on infrastructure and commodity flows, see monitoring supply chains and commodity disruptions.
Workflows for Traders
Agricultural and soft commodity traders
- Watch Climate Anomalies for drought and excess rain in major growing regions.
- Check Fires for burning across farmland and plantations.
- Use the Natural Events and Weather Alerts layers during storm seasons.
- Track freight in the Supply Chain panel if river or port logistics are at risk.
Energy traders
- During hurricane season, keep Natural Events and Weather Alerts on over producing and refining regions.
- Cross-check with the Energy Disruptions Log and Pipeline Status in the Energy tab.
- Watch heat anomalies for power and gas demand.
Insurance and macro analysts
- Use Population Exposure to size the human impact of a major event.
- Check the Country Instability Index for countries where a disaster lands on top of existing fragility.
- Watch displacement and outbreak data for second-round effects.
Everyone
- Signed-in users can add keyword monitors in My Monitors on their dashboard, for example “earthquake”, “hurricane” or “drought”, so matching headlines stand out.
Why a Single View Helps
A disaster does not happen in isolation. Its market impact depends on the infrastructure it hits, the stability of the country it hits, the commodities produced there and the trade routes nearby. The Planet shows all of these in one place. For an overview of every tab, see What Is The Planet?.
Frequently Asked Questions
What earthquake data does The Planet use? The Planet uses the USGS feed of earthquakes of magnitude 4.5 and above worldwide, shown on the map alongside infrastructure, conflict and instability layers.
How does The Planet detect fires? Fires come from NASA FIRMS satellite detections (VIIRS). The Thermal Escalation panel compares thermal clusters with baselines to flag abnormal activity, including activity that may be conflict-related.
Is disaster monitoring free? Yes. The Climate tab, the Disaster Cascade panel and the hazard map layers are free to use.
Track hazards and their market impact at theplanet.today/app/climate.